EXTREME EVENTS
THE LINK BETWEEN WILDFIRES AND CLIMATE CHANGE
BY RICK MCRAE
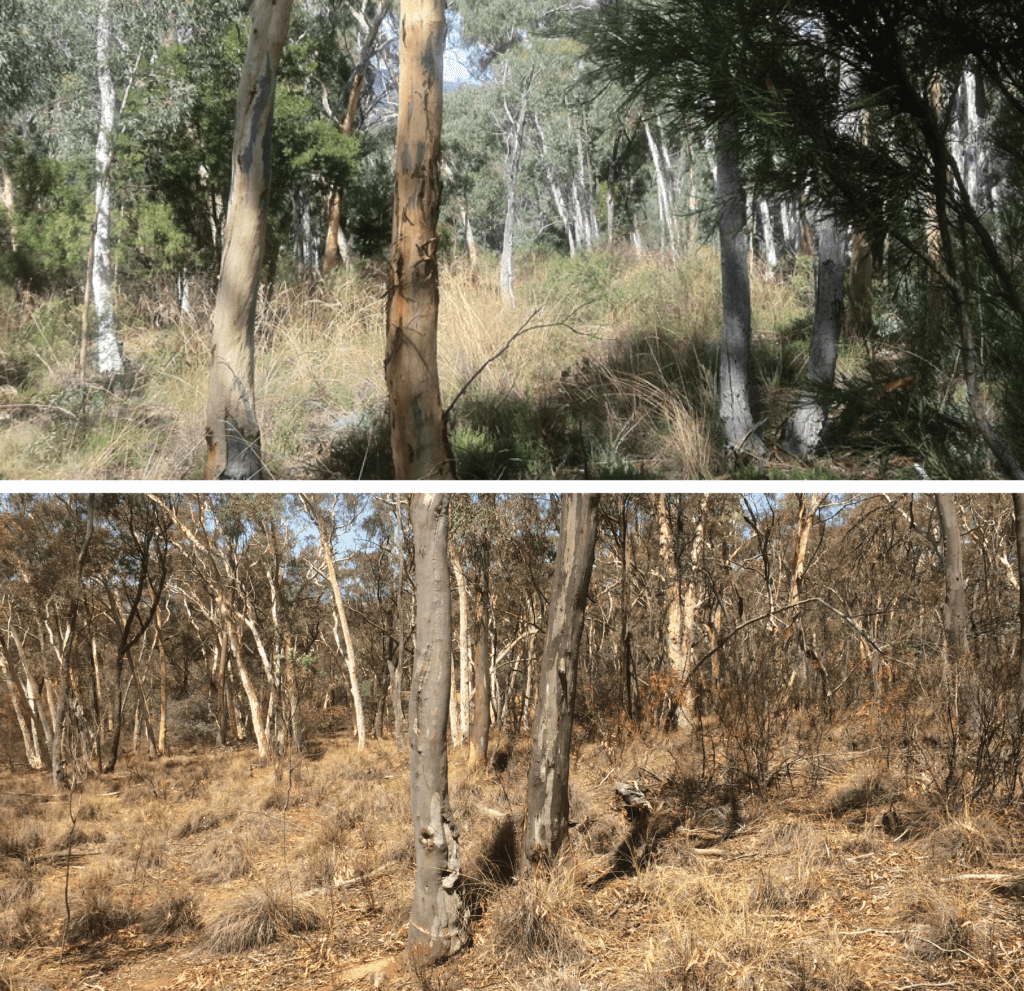
PHOTOS BY RICK MCRAE.
I used to think I knew a lot about wildfires or bushfires. Then my operational experiences made me unsure. Due to what is now known to be the effects of climate change on extreme fires, it turns out I have spent the last couple of decades proving myself wrong. I would like to relate my tale and in doing so tell you why extreme wildfires have become such a major challenge. It is no longer enough to watch these fires and study them scientifically – we all must implement a lot of new learnings if we are to keep our communities safe into the future.
My colleagues and I heard stories in the 1990s about noteworthy wildfires in Australia that generated lessons to be learned – this was part of our professional development. We heard about the 1983 Ash Wednesday fires and the 1998 Linton fire and the significance of the wind change. There was clearly a pattern in the narrative, if not in the field. We had a lecture from Oakland Fire Chief Lamont Ewell about harrowing experiences in the Tunnel fire (Oct. 19, 1991; 38°N 122°W). We all knew about the Santa Ana winds and the resulting fire behaviour that was so difficult to control. Whew, at least we didn’t get them in Australia.
I was the planning officer for the 2003 Australian Capital Territory firestorm (McIntyres Hut fire and Bendora fire, Jan. 18, 2003; 35°S 149°E). The impact on Canberra was devastating; four people died, more than 490 were injured, and 512 homes were destroyed or severely damaged.
I spent the next five years heavily involved the coronial inquiry into those fires. Coroners are empowered to explore the cause and origin of damaging fires. In doing so, the coroner made it unduly inquisitorial, so much so that I and three colleagues took her to the Supreme Court twice to consider bias in her conduct. Her findings were a list of “the usual suspects”: training, communications, equipment, procedures, facilities, and so on. Her stance was that these all needed to be improved if a repeat was to be avoided.
One thing the coroner deliberately avoided considering (despite requests from lawyers) was the emerging science from those fires. Lawyers are quicker to reach conclusions than scientists, but there had already been some papers published that showed that these fires were, indeed, salient fires.
Mike Fromm, the leader of an international collaboration on fire thunderstorms, invited me to join scientists from the United States, Canada, Israel and Australia who were writing a paper about the 2003 fires. Another noteworthy past fire – the Berringa fire in Victoria (Feb. 25 1995; 40°S, 144°E) – had formed a thunderstorm in its plume; as with any thunderstorm near a fire, there were significant safety issues to watch for, such as downdraught winds. I had also watched, in satellite imagery, a fire in the Victorian high country form a storm that rained on the fire and put it out (at Caledonia River, Feb. 2, 1998; 37°S, 147°E). Was this just a storm or was it due to the fire?
Technically, fire thunderstorms have a formal name – pyrocumulonimbus – but it is shortened to pyroCb. PyroCbs were a clear sign of just how far off the scale the 2003 fires were. Plus, we had good data on the first ever confirmed fire tornado – a 2012 paper titled An Australian pyro-tornadogenesis event “demonstrate[d] that this was indeed a fire tornado . . . and not a fire whirl.” With the field data on the fire and the plume, and the science on the upper atmospheric impacts, we had a useful case study. Internationally, there was a previous major case study from a fire in Canada, the Chisholm fire near Edmonton, Alberta (May 29, 2001; 55°N, 114°W). It became clear that we needed to build up case studies to improve our understanding of these events and their causes.
I was co-leader of part of a federally funded research project, the HighFire Project. HighFire Risk was run out of the University of New South Wales (UNSW) at the Australian Defence Force Academy (ADFA) in Canberra as part of the Bushfire Cooperative Research Centre. ADFA had a longstanding prominence in Australian bushfire research. The research team obtained the services of a young mathematician, Jason Sharples, who is now a tenured professor and leader in many scientific aspects of extreme wildfires.
This project led to a wide range of learnings, if not outright discoveries. We needed to understand what surface winds did to the 2003 fires, so we deployed weather stations across rugged landscapes. The results were surprising because meteorologists must avoid putting weather stations in the really interesting side slopes. We looked at imagery showing unexpected fire spread patterns; this showed a strong association with landform elements prone to the lee-slope eddy winds that we now knew were a key part of the story. With the awkward formal name of Vorticity-driven Lateral Spread, VLS is now globally known to be a leading cause of catastrophic fire escalation in rugged landscapes.
We worked on dew point depression anomalies and foehn wind events. We showed that foehn winds do cause rapid changes in fire danger in Australia, but good case studies were limited; we spent a decade looking for them, with limited results. We spent a lot of time on research dissemination. With the growing uptake of the fire behaviour analyst role over the last two decades, there was new cadre of people eager to learn about these processes. They were often especially interested in pyroCbs.
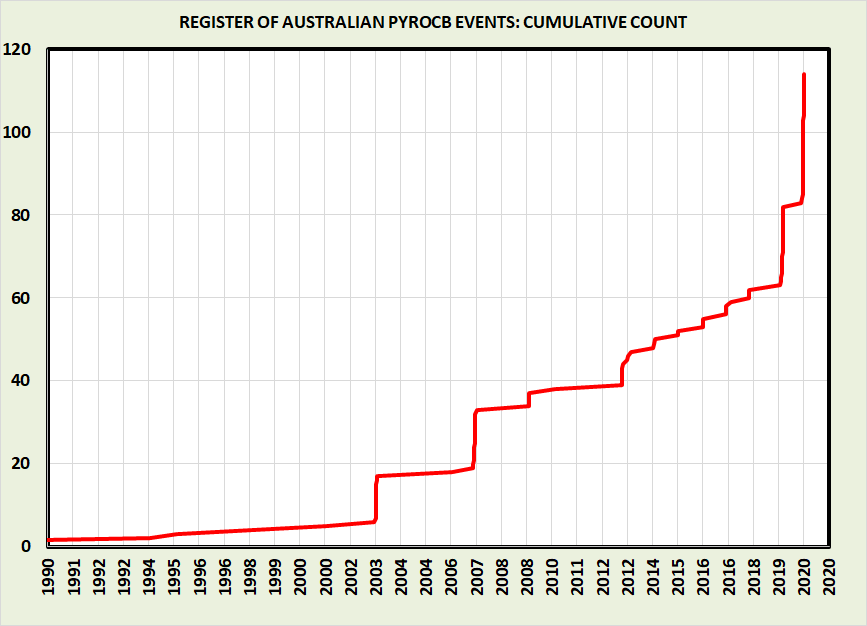
I maintained the Australian pyroCb register, with help from colleagues in Australia and overseas. Unfortunately, every few years we saw another uptick in the cumulative case count curve; it was clearly a new trend that needed understanding.
It became clear that this extreme fire behaviour was a major, global problem. Australia got world attention in 2003, and again during the 2006-2007 Victorian high-country fires (many fires, from Dec. 3, 2006; around 37°S, 147°E), and again on Black Saturday in Victoria (many fires; Feb. 7, 2009; 37°S, 145°E). We saw a cluster in the Great Victoria Desert (many fires; Oct. 18,2012; centred on 27°S, 126°E), most likely reflecting a pulse of plant growth after an infrequent inland rain event. So, with the same type of event occurring in arid lands, taiga, Douglas fir forests and Alpine Ash forests, there was a question to ponder about the role of fuel. There is still no obvious concept of a role for fuel load as a variable.
I was a fire behaviour analyst in British Columbia in 2017 when the record-breaking Pacific northwest event (PNE) occurred on Aug. 12; this was so far beyond what had been seen that satellite indices had to be rescaled. At least this time around I knew what was happening, and I opened an ops briefing with the claim that “Your fire has been making ice.” The plume reached into the stratosphere, where the air temperature was perhaps -60 C. There were eight pyroCbs that evening as a cold front pushed through. The vast smoke plume was pushed over the Arctic to Russia and over the Greenland ice cap. This was what has become known as an outbreak of pyroCbs.
Back home, I began looking at what the fires had done on the ground; this was the real eye opener. The Chezacut fire (part of the Plateau Complex; Aug. 12, 2017; 51°N, 121°W) made a midnight run of 40 kilometres, passing right over a previously burned area nearly 10 kilometres wide. It was fortunate that this is an area that was not crewed at night.
About that time, a paper was published in which we carefully defined our terms. Normal fires follow steady-state processes – if you know the weather, terrain, and fuel then you know what the fire will do (with a few exceptions). Under certain conditions, a fire couples with the atmosphere above and becomes a dynamic fire. Now, you also need to know the stability and dryness of the atmosphere overhead (the profile), and you need to know the fire itself. Having the fire depend on the fire creates a potential for a feedback loop; this is a lot more complex. Dynamic fire forms what we called a Blow-Up Fire Event (BUFE). Any fire that includes one or more BUFEs is termed an extreme wildfire.
How does the coupling come about? Our pyroCb case studies told us that you need deep flaming under an unstable profile. Normal fire spread is by means of a fireline, which can be intense and fast spreading, but is a line. Deep flaming is when a fire polygon forms instead; this changes the way that the convection column evolves as it rises. If the column is still expanding and not mixing out when it reaches the cloudbase, the water vapour in the plume condenses and more heat is released, re-energizing the system; it is like turning on a very large extractor fan above the fire. This phenomenon dominates surface winds, and the rising air may be replaced by drier descending air, raising the fire danger. Then the feedback loop is in place.
So far there are seven documented potential causes of deep flaming. A strong wind will push even a steady-state fire a long way during the fuel burn-out time. A wind change (this is where the old ideas meet up with lots of new ones) may create a wider new headfire from a flank. As mentioned, VLS is the most efficient mechanism known. When fire enters a lee-slope eddy wind, the vorticity pushes fire sideways (at up to 5 km/hr) and causes dense spotting for kilometres downwind. A review of the Kings Cross tube station fire in London (Nov. 18, 1987; 52°N, 0°W) indicated eruptive spread and involves flame attachment in a trench-shaped channel. Sharples, Domingos Viegas, and others have studied this process in detail; it has caused a number of serious fireground burn-over incidents. Post-fire photos that I took in 2017 at the Elephant Hill fire in British Columbia (51°N, 121°W) showed that eruptive spread can occur in parallel and create deep flaming. Dense spotting can arise from several processes and spotfire coalescence has been studied in detail as a cause of enhanced fire intensity. The use of accelerant (drip torches or aerial) using long-established techniques under the direction of an incident action plan has created some of the most intense BUFEs if the ignition pattern changes the mixing of indraft air. Interior ignition is my working term for a hot fire mosaic across a landscape in North America where each area of the vegetation types present has an unsynchronized onset of full fuel flammability. The mosaic of areas that do light up on any day can act like deep flaming.
Deep flaming links back to case studies, and thus to salient fires. An unstable profile is seen in weather balloon flights, flown in Australia by the Bureau of Meteorology and more recently by fire services due to coronial recommendations from the Wambelong fire in New South Wales (Jan. 13, 2013; 31°S, 149°E).
There was enough information in 2013 to try out a predictive model for BUFEs, called the Blow-Up Fire Outlook (BUFO, a reference to Cane Toads, Bufo marinus, which are a major pest in Australia). BUFO asked questions based on observations or forecasts to see if the conditions for deep flaming under an unstable profile was likely as a fire spreads. The model assumed elevated fire danger as a boundary condition. BUFO worked, producing several BUFO alerts that were passed on to bushfire operations centres.
PyroCbs continued to be at the centre of BUFO, as they were (mostly) readily confirmed – more so than a BUFE.
Then along came Black Summer, and all of this changed. In a pre-season operations briefing I put the tagline on my outlook, “As bad as it can get.” It seems that I understated it. In hindsight, Black Summer really began in early March 2019, when a major outbreak of BUFEs and pyroCbs occurred in the eastern Victorian high country and central Tasmania. Some of what happened still cannot be explained. Then fires started in August behind Brisbane. As in most fire seasons, the activity pattern slowly moved southwards, ending in Victoria in February 2020.
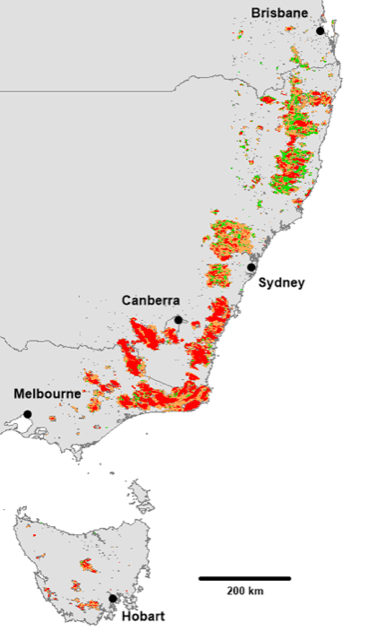
Some highlights: the world’s first “super outbreak” with unprecedented activity levels, the highest smoke ever recorded (in the ozone layer, above 35 kilometres); a doubling in the length of the Australian pyroCb Register; Canberra recorded the world’s worst air quality; and so on. I worked on the fire side of a major collaborative paper on the super outbreak. A remarkable graph showed that, in broad terms, on Jan. 4, 2020, fire activity peaked at nearly one million megawatts due to a burn rate of almost 100,000 hectares per hour. Plume cloudtops passed 16 kilometres. This area that has seen a number of outbreaks this century.
Now the really interesting bit. North of Sydney, there have been pyroCbs recorded, even clusters of them, but no outbreaks. About 40 per cent of the nearly 140 BUFEs recorded that season were in the north. The profile was often not unstable, and at times quite stable. The first two confirmed dangerous Australian BUFEs due to the foehn effect had been recorded in the previous three years at Tathra (March 23, 2018; 37°S, 150°E) and Holsworthy (April 15, 2018; 34°S, 151°E). Australia suddenly went from two to nearly 50 foehn-driven BUFEs.
Having been trained as an ecologist, I switched from case studies to population statistics. Entirely new concepts became available for predictive use. BUFO2, the new version being finalized, is no longer concerned with pyroCbs, although a prediction of them is a by-product. The real concern is the BUFE on the ground, the events that destroyed vast tracts of Australia’s forests over six months. BUFO2 ingests observation and forecasts and looks at the profile. However, it considers both ascending and descending air. Explicitly considering foehn winds in Australia now makes us worryingly similar to California and other regions plagued by fire winds. Suddenly Chief Ewell’s report is a lot more relevant, and we need to have long chats with our colleagues in California and the Mediterranean.
BUFO2 includes a statistical analysis of radiosonde data, covering the cloudbase height, convective cap, dew point depression near the cloudbase (equivalent to a dry slot in water vapour satellite imagery) and C-Haines (a continuous variant of the mid-level Lower Atmosphere Stability Index). Ascending BUFEs need small caps; descending BUFEs prefer large caps. Both can benefit from dew point depression events. A high cloudbase is ensured by the elevated fire danger boundary condition.
Switching to a statistical approach also strengthened an element that was problematic using case studies – avoiding biases. A predictive model should not just predict an event at “that fire there,” but also not predict events on “those fires over there,” Case studies have not looked at the second set.
PyroCbs cause mayhem, and as we saw north of Kamloops, B.C., (June 30, 2021; 51°N, 121°W), can start new fires through pyrogenic lightning. Air ops may be grounded. However, BUFEs are a far more serious problem for the incident management team. A dynamic risk assessment should indicate that during a BUFE the incident action plan has one objective – saving lives. BUFEs have been seen to run nearly 60 kilometres overnight, in unprecedented directions. One night during Black Summer there were five of these running side by side. How do you set an IAP for that?
I’m developing a technique to use satellite hotspot data to classify how fire burned across the landscape during extreme wildfires: minor activity; typical fire runs; complex burning out or interior ignition over many days; and BUFEs. This shows that BUFEs are not necessarily getting bigger, rather that extreme wildfires are forming more of them, and they are often overlapping. IMTs face extraordinary challenges handling this.
A lot of the extraordinary activity during Black Summer has all the hallmarks of climate change; things will continue to deteriorate while we wait for emissions reductions to occur. Due to climate change, BUFO2 may become obsolete quite quickly as we acquire and analyze data from new events. But where will the new data come from? Brazil? Sweden? Russia? South Africa? As I mentioned, lawyers are quicker off the mark than scientists. The gap between the products of the two groups cannot be allowed to grow.
I’ve recently retired from emergency services and am an adjunct professor at UNSW at ADFA working to finish the studies of Black Summer and to disseminate the material that I’ve discussed. A real challenge is convincing highly effective fire services of the need to adapt in a setting of conflicting messages. The 2003 coronial inquiry produced a long list of findings, many highly critical of senior officials such as me. The coroner’s experts showed, after the fact, that the outcome of the fires could have been predicted, and therefore those in charge should hold some level of responsibility. There is now an alternative, scientifically backed, view of those fires – that they were the first major impact of climate change on an Australian city, and their complexity was unprecedented for Australia, if not the world. Fires near Perth, Melbourne, and Sydney have been almost as extreme. A solid proof of climate change’s role is perhaps still to come, but can we afford to wait?
ABOUT THE AUTHOR
 Rick McRae served as a headquarters technical specialist in what evolved to become the ACT Emergency Services Agency in Canberra from 1989 until his recent retirement. He worked in business planning, arson investigation, multi-hazard risk assessment, as planning officer for major incidents, weather specialist, and as a research scientist focussing on extreme wildfires. He is now an adjunct professor with the Bushfire Research Group at UNSW Canberra at ADFA.
