THE FUTURE OF FORECASTING FIRE DANGER  ILLUSTRATION BY JENNIFER HOLLIS
BY JEN HOLLIS AND STUART MATHEWS
To most Australians, fire danger forecasting is embedded within our cultural identity and history. It’s as Australian as kangaroos, the Holden Ute and the Sydney Opera House.
For the last six decades Australians have relied heavily on the pioneering work of Alan McArthur who developed the Forest Fire Danger Index and Grassland Fire Danger Index. The system has served Australians well and with only minor adaptations to meet local needs, it remains largely unchanged. The most significant adjustment came after the 2009 Black Saturday fires in the state of Victoria which, in one afternoon, burned through more than 450,000 hectares and resulted in the devastating loss of 173 lives.
Following a Royal Commission investigation into the fires, it was recognised that McArthur’s system was being applied well beyond the original design. As a result, categories were added, including one at the top end of the fire danger scale reflecting conditions beyond the existing maximum of 100. Importantly, it was also recognised that there was a need to incorporate new science and technological developments (for example, remote sensing, landscape mapping, higher computational capability) into the calculation and interpretation of fire danger.
Over the last two decades, advancements in weather forecasting and fire behaviour knowledge have improved our collective understanding of fire dynamics and its relationship with fuels and weather variables, fire-atmosphere interactions, potential impacts, suppression requirements and safety considerations. Fire authorities also have a better understanding of how to effectively communicate to the community to trigger necessary action. Our knowledge of atmospheric instability and potential for coupling has increased. Our understanding of fire behaviour and fire spread has expanded from grouping all vegetation into either forest or grassland to better reflect the diversity of vegetation around Australia, including grassy woodland, spinifex, shrubland, mallee-heath, pine and buttongrass vegetation types. The nature of the McArthur system however has dictated that very few of the advancements are able to be incorporated.
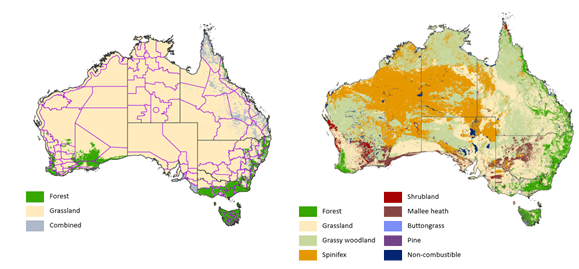
Knowledge of fire behaviour and fire spread has expanded from grouping all vegetation into either forest or grassland (left), to better reflect the diversity of vegetation around Australia including woodland, spinifex, shrubland, mallee-heath, pine and buttongrass vegetation types (right). GRAPHIC BY BELINDA KENNEY, NSW Rural Fire Service.
FIRE DANGER: WHAT DOES IT MEAN?
In Australia, fire danger has become a general term with many interpretations and applications that have evolved over time. Forty three years ago, McArthur summarized fire danger as: “ . . . in a general sense, the rating of fire danger is an expression of probable fire behaviour in relation to a particular set of fuel and weather conditions.”
Until recently, most fire management authorities found this was sufficient for representing suppression difficulty and for setting readiness levels however, interpretation and utilisation of fire danger forecasts vary a great deal. Some choose to align the forecast with the original descriptions of suppression difficulty, rate of spread, fire growth and flame heights. Others may refer to a modified version of that information to better represent local conditions and management styles. Often, people involved in fire management will interpret the forecast against their own experience or simply against the name of the rating, where a Low forecast fire danger can be interpreted as low fire danger or Catastrophic simply as being catastrophic. The outcome is a diversity of mixed understandings, where fire danger has become a little bit of everything and nothing that’s consistently defined.
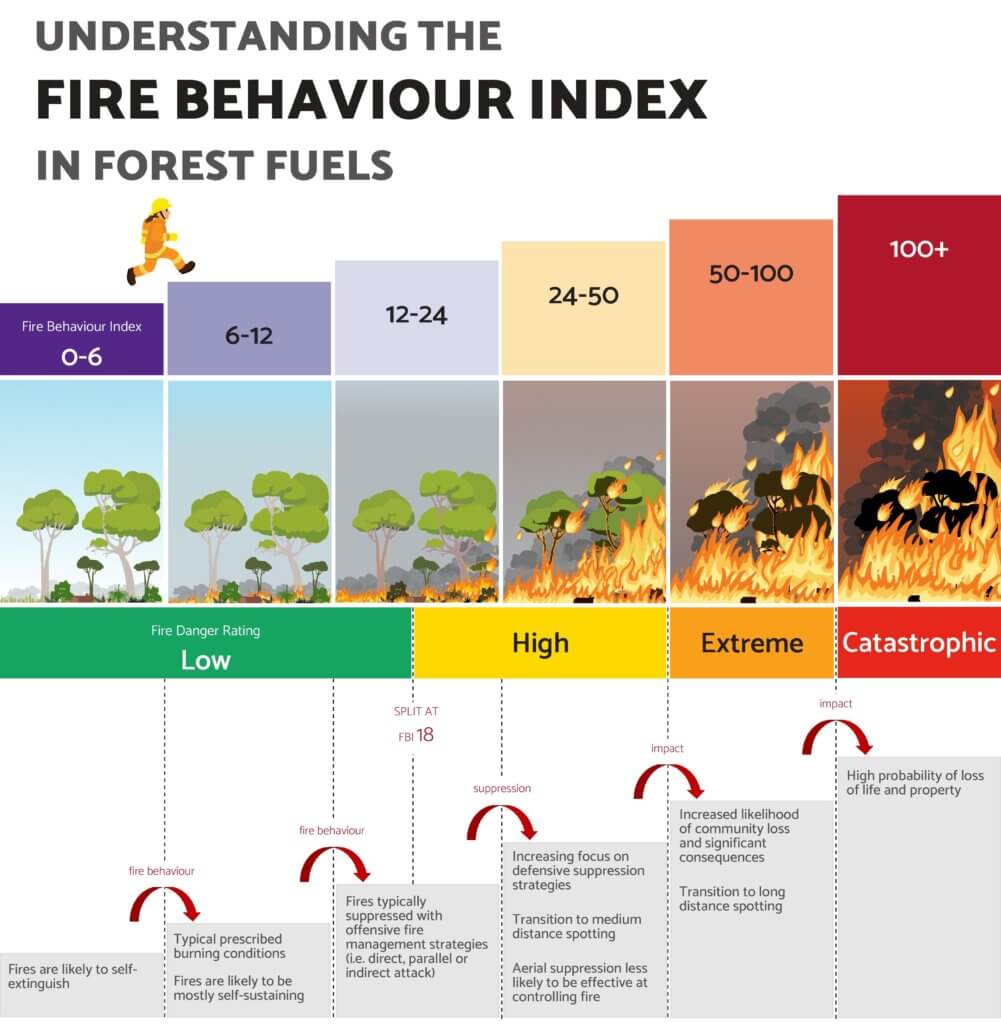
Australia’s Fire Behaviour Index is made up of step-ups, or transitions, that indicate a shift in category and are triggered by a change in fire behavior, suppression response, or potential for impacts.
ILLUSTRATION BY JENNIFER HOLLIS
AUSTRALIAN FIRE DANGER RATING SYSTEM
In 2014, Australian governments agreed that the development of a new system was a national priority. Subsequently, project planning for an Australian Fire Danger Rating System began in earnest. With funding support from the Australian government’s National Emergency Management Projects program and the New South Wales Rural Fire Service’s Bush Fire Risk Mitigation and Resilience Program, development and testing of a research prototype began in 2017. The research prototype was largely based on fire behaviour and fire-spread calculations on a gridded spatial scale (linked to the Bureau of Meteorology’s gridded weather forecast product), in eight major fuel types covering Australia. The objective of the research prototype project was to demonstrate that it was feasible to develop a fire danger rating system based on fire behaviour models that was national, modular, and open to continuous improvement. Testing of the research prototype over consecutive fire seasons around Australia showed that the research prototype performed better than the current system.
At the same time, work commenced to understand and improve community warnings and needs. Through surveys and small working groups, it was found that while many Australians could recall seeing fire danger rating information on roadside signs and forecasts, many people were unable to describe what fire danger is and could not recall taking actions in relation to fire danger. In response, four design principles were put forward to target how to provide fire
danger forecasting information to the public including fewer levels, logical colours, simple English terms, and action-oriented messaging.
In 2019 the system build commenced. Implementation and go-live is planned for 2022 and until then the system continues to be built and refined.
Based on the different needs of fire operations and the Australian community, the Australian Fire Danger Rating System includes two components:
1) Fire Behaviour Index: A numerical scale of fire danger developed specifically for operational users and fire management decision making; and
2) Fire Danger Rating: Consisting of broad categories designed to quickly communicate the potential level of fire danger to the public. Categories are set against outputs of the Fire Behaviour Index.
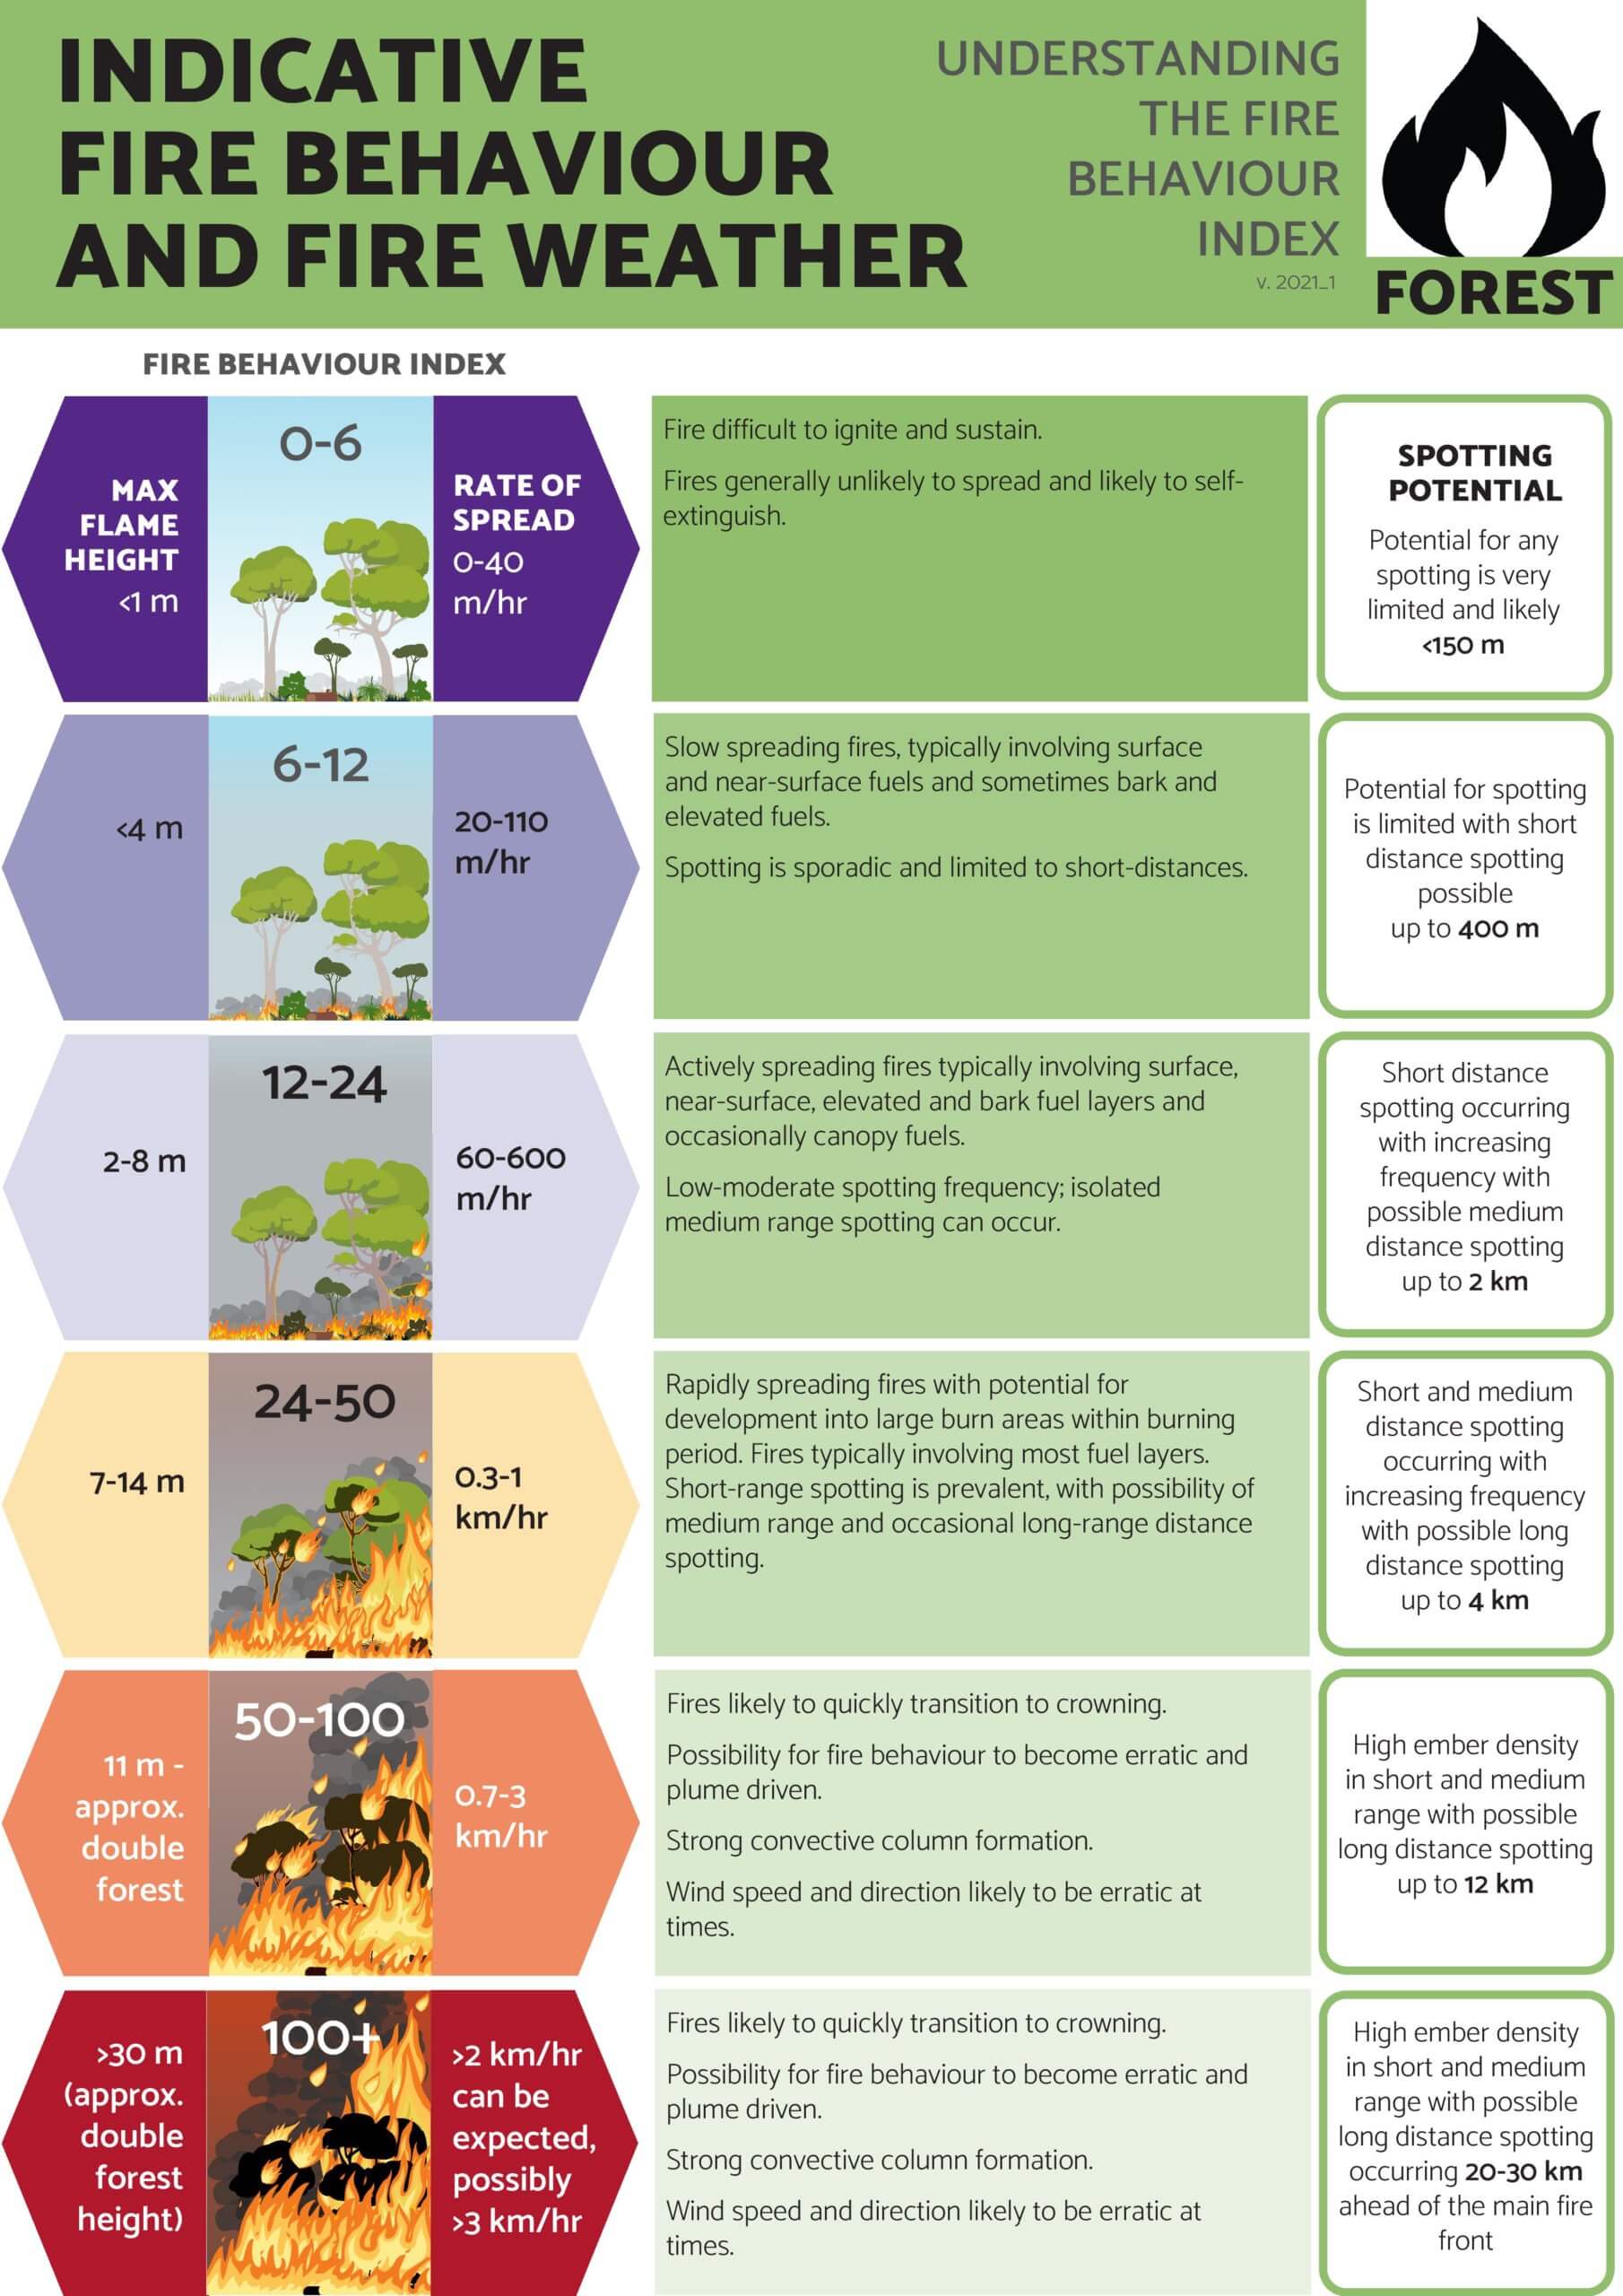
The Fire Behavior Index is determined through models for fire spread rate or other fire behaviour characteristics, such as likelihood of spread and crowning.
FIRE BEHAVIOUR INDEX: TRANSITIONS
To get the most out of the Fire Behaviour Index (FBI) and realise the opportunities intended to assist and improve decision making, it’s important that users have a good understanding of the underlying structure and how it differs from the current system. Unlike the current McArthur system, which presents categories as pieces of a half-pie with fire danger increasing against McArthur’s Fire Danger Index, the Fire Behaviour Index is made up of step-ups or transitions. These transition points indicate a shift in category and are triggered by a change in 1) fire behaviour 2) suppression response or 3) potential for impacts.
In Figure 2 for forest fuels, categories are generally split into cool colours (variations of dark to light purple) and warm colours (yellow, orange and red). The bottom category (FBI: 0-6, dark purple) represents conditions in which fires are unlikely to spread. When conditions increase to support a spreading, self-sustaining fire, fire danger steps up to the next category (FBI: 6-12, purple). The range of conditions in this category are aimed at representing typical prescribed burning conditions. A step upwards in conditions is the point at which prescribed burning is generally no longer suitable, but fires are still mostly suppressed with offensive strategies (FBI: 12-24, pale purple).
The next transition is linked to a change in suppression response, when operations typically start moving away from offensive suppression success and increasingly focus on defensive suppression strategies (FBI: 24-50, yellow). This category may also trigger the need for additional resources and strategic placement of resources. The final two categories (FBI> 50, orange and red), are set based on increasing likelihood of community losses, more specifically houses, and potentially lives. The top two categories are very similar in that they represent particularly dangerous fire behavior, however the top category (FBI: 100+, red) is aimed at representing conditions where historically there have been significant life and house losses.
Consistent transitions across fuel types are established for each broad fuel type despite the diversity of fire behaviour, suppression response and potential for impacts often observed between each of the eight fuel types. Not all fuel types require the five transition points described for forest fuels to represent the unique characteristics, decisions and response required. As a result, three to five transition points are applied depending on fuel type.
THRESHOLD VALUES
Between each of the categories are threshold values that determine where the transition occurs. During the development of the research prototype, it was established that the points that define each category needed to be specific to each fuel type. For most fuel types, fireline intensity was identified as the most suitable variable since it is a simple calculation based on rate of spread, and because of existing alignments with suppression difficulty, firefighter safety, community impact and loss and fire behaviour. In some fuel types, the fire-spread model was suitably built to indicate the transitions aligned with model outputs including probabilities of specific fire behaviours.
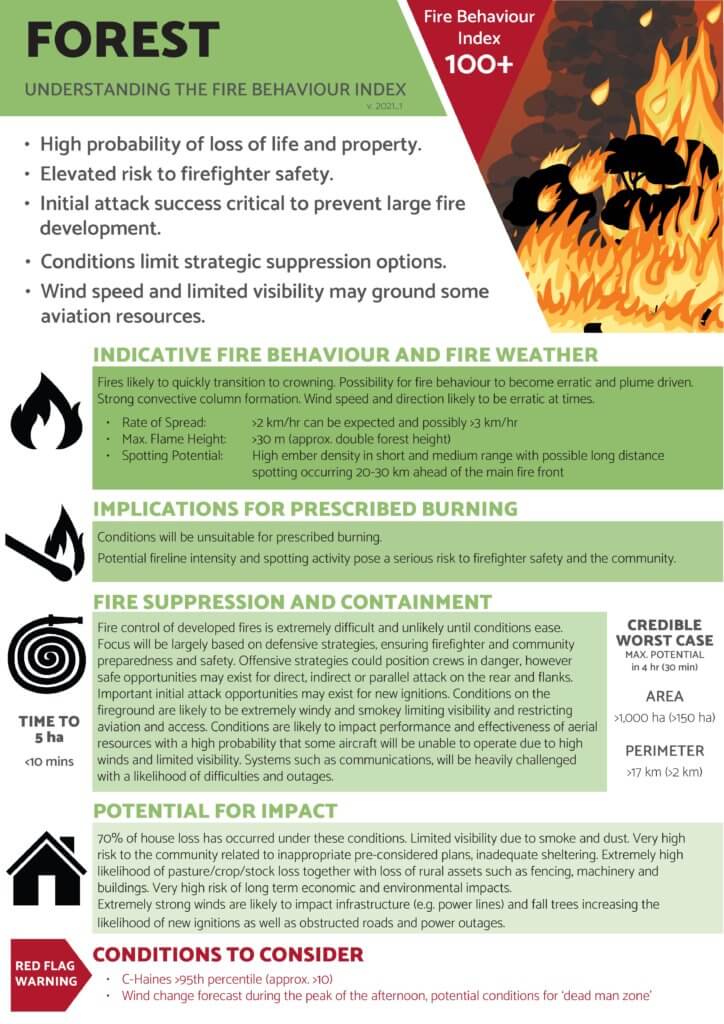
Fire Behavior Index Tables provide users with clear and consistent descriptions of indicative fire behavior and fire weather, implications for prescribed burning, fire suppression and containment, and potential for impact.
HOW IS THE INDEX CALCULATED?
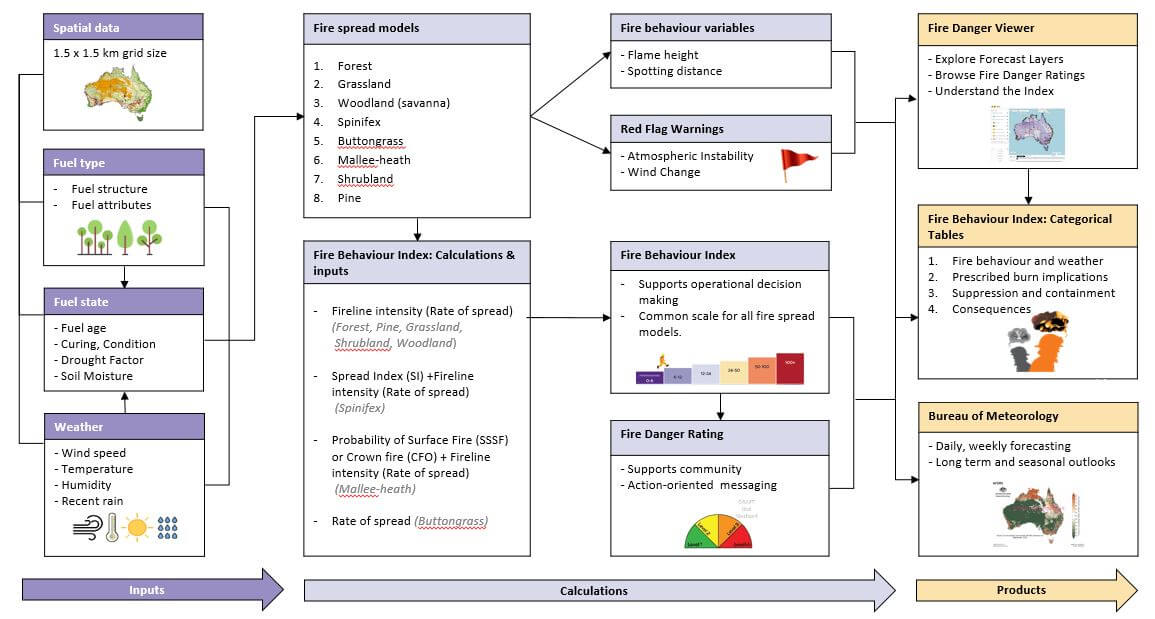
The Fire Behaviour Index is determined through models for fire-spread rate or other fire behaviour characteristics, such as likelihood of spread and crowning. Different fuel types have distinct fire behaviour characteristics driving the Fire Behaviour Index. Calculations for the AFDRS begin with input data at the 1.5 kilometre spatial scale across Australia to enable alignment with the Bureau of Meteorology’s gridded weather forecast. Inputs include fuel type and fuel state information, which are applied to calculate the variables needed for the Fire Behaviour Index. For most fuel types this variable is rate of spread which is used to then determine fireline intensity.
In addition to the Fire Behaviour Index, fire behaviour variables including flame height and spotting are calculated as supplementary information. Red flag warnings are also provided to accompany forecasts to indicate conditions that support atmospheric instability and forecast wind directional change. Supplementary variables and red flag warnings don’t influence the forecast Fire Behaviour Index or the Fire Danger Rating, however fire managers are able to use the information to identify additional considerations.
The Fire Behaviour Index can be used at this point for operational decision making by applying the relevant categorical table/s of descriptions. The Fire Behaviour Index is also directly applied to determine the Fire Danger Rating, which provides community members with the information they require to actively respond to conditions. The forecasting information comes together and can be accessed via the Fire Danger Viewer or the Bureau of Meteorology’s online forecasting products, which are provided for both short -term and seasonal forecasting.
CLEAR AND CONSISTENT DESCRIPTIONS
With established transition points that trigger each category, the Fire Behaviour Index is supported by clearly and consistently described forecast conditions. In this way, uncertainty is reduced and users are provided with information they need to assist decision making.
Information provided seeks to answer important questions:
1) What will a fire look and behave like (if it occurs)?
2) How difficult is a fire likely to be to suppress or contain?
3) Generally, how suitable are the conditions for prescribed burning?
4) What are the likely impacts based on actual historical community losses?
Information is provided in tables for each category, for each fuel type. The same descriptions are also provided by information type, for each fuel type. allowing easy comparison across ‘
GO-LIVE
Forecasts of fire danger in Australia are planned to switch to the Australian Fire Danger Rating System in 2022. There is a lot to accomplish and prepare before the system gets officially turned on, including development and testing of suppression, ignition and impact indices to support fire danger forecasting, an operational trial for the Fire Behaviour Index and Fire Danger Rating and continued work with operational users to prepare for the change.
THE LEGACY OF ALAN MCARTHUR
The Australian Fire Danger Rating System incorporates advances in our collective understanding of fire danger that began many years ago with the work of McArthur and his team. As we move forward into the future of fire danger forecasting in Australia we give a nod, tip our hats and say our thanks for providing us with a system that has stood the test of time and provided the foundation for us to progress and improve our understanding of fire behaviour and fire danger in Australia. Through a modular platform the Fire Behaviour Index will continue to improve by incorporating scientific advancements and developments.
AUTHORS’ NOTE
We acknowledge that many people and contributions have made this work possible and bought us to the position we are today. From those who have mapped bushfire fuels in their local areas to national and international researchers who have committed their years to better understanding fire behaviour and fire danger, we say thank you! Development of the Fire Behaviour Index has also relied on the expertise and participation of many people involved in fire operations as well as national and international researchers, whose efforts and support have been greatly appreciated.
The Australian Fire Danger Rating System has been funded by the Australian government and each state and territory government, working together to improve fire danger ratings and community safety as a national priority.
Additional information on the Australian Fire Danger Rating System can be found at https://www.afac.com.au/initiative/afdrs. For further reading on fire behaviour and fire spread in Australia, we recommend A Guide to Rate of Fire Spread Models for Australian Vegetation by Cruz et al. (2015).
ABOUT THE AUTHORS
 Jennifer Hollis is a research officer and a fire behaviour analyst of the New South Wales Rural Fire Service. Hollis is working on development of the Australian Fire Danger Rating System, specifically on the Fire Behaviour Index and its operational application. Previously, Hollis has conducted bushfire research and worked on a diverse range of research projects including development of the framework for an Australian Bushfire Fuel Classification, modelling woody fuel consumption, assessing the effectiveness of aerial suppression, establishing better techniques for the determination of grassland curing, and quantifying capacity for carbon storage within West Australian forest ecosystems. Hollis completed her PhD in mathematics and statistics in 2011 with the University of New South Wales at Australian Defence Force Academy.
 Stuart Matthews, Ph.D, is a principal project officer of the New South Wales Rural Fire Service. Matthews is responsible for developing tools and systems to support fire behaviour predictions, including an ensemble modelling system. He has also been closely involved in supporting research projects to develop improved fire behaviour models. Stuart leads the New South Wales Rural Fire Service contribution to the implementation of the Australian Fire Danger Rating System.
