Fire in the North THE 2020 SIBERIAN FIRE SEASON
Susan G. Conard and Evgenii Ponomarev
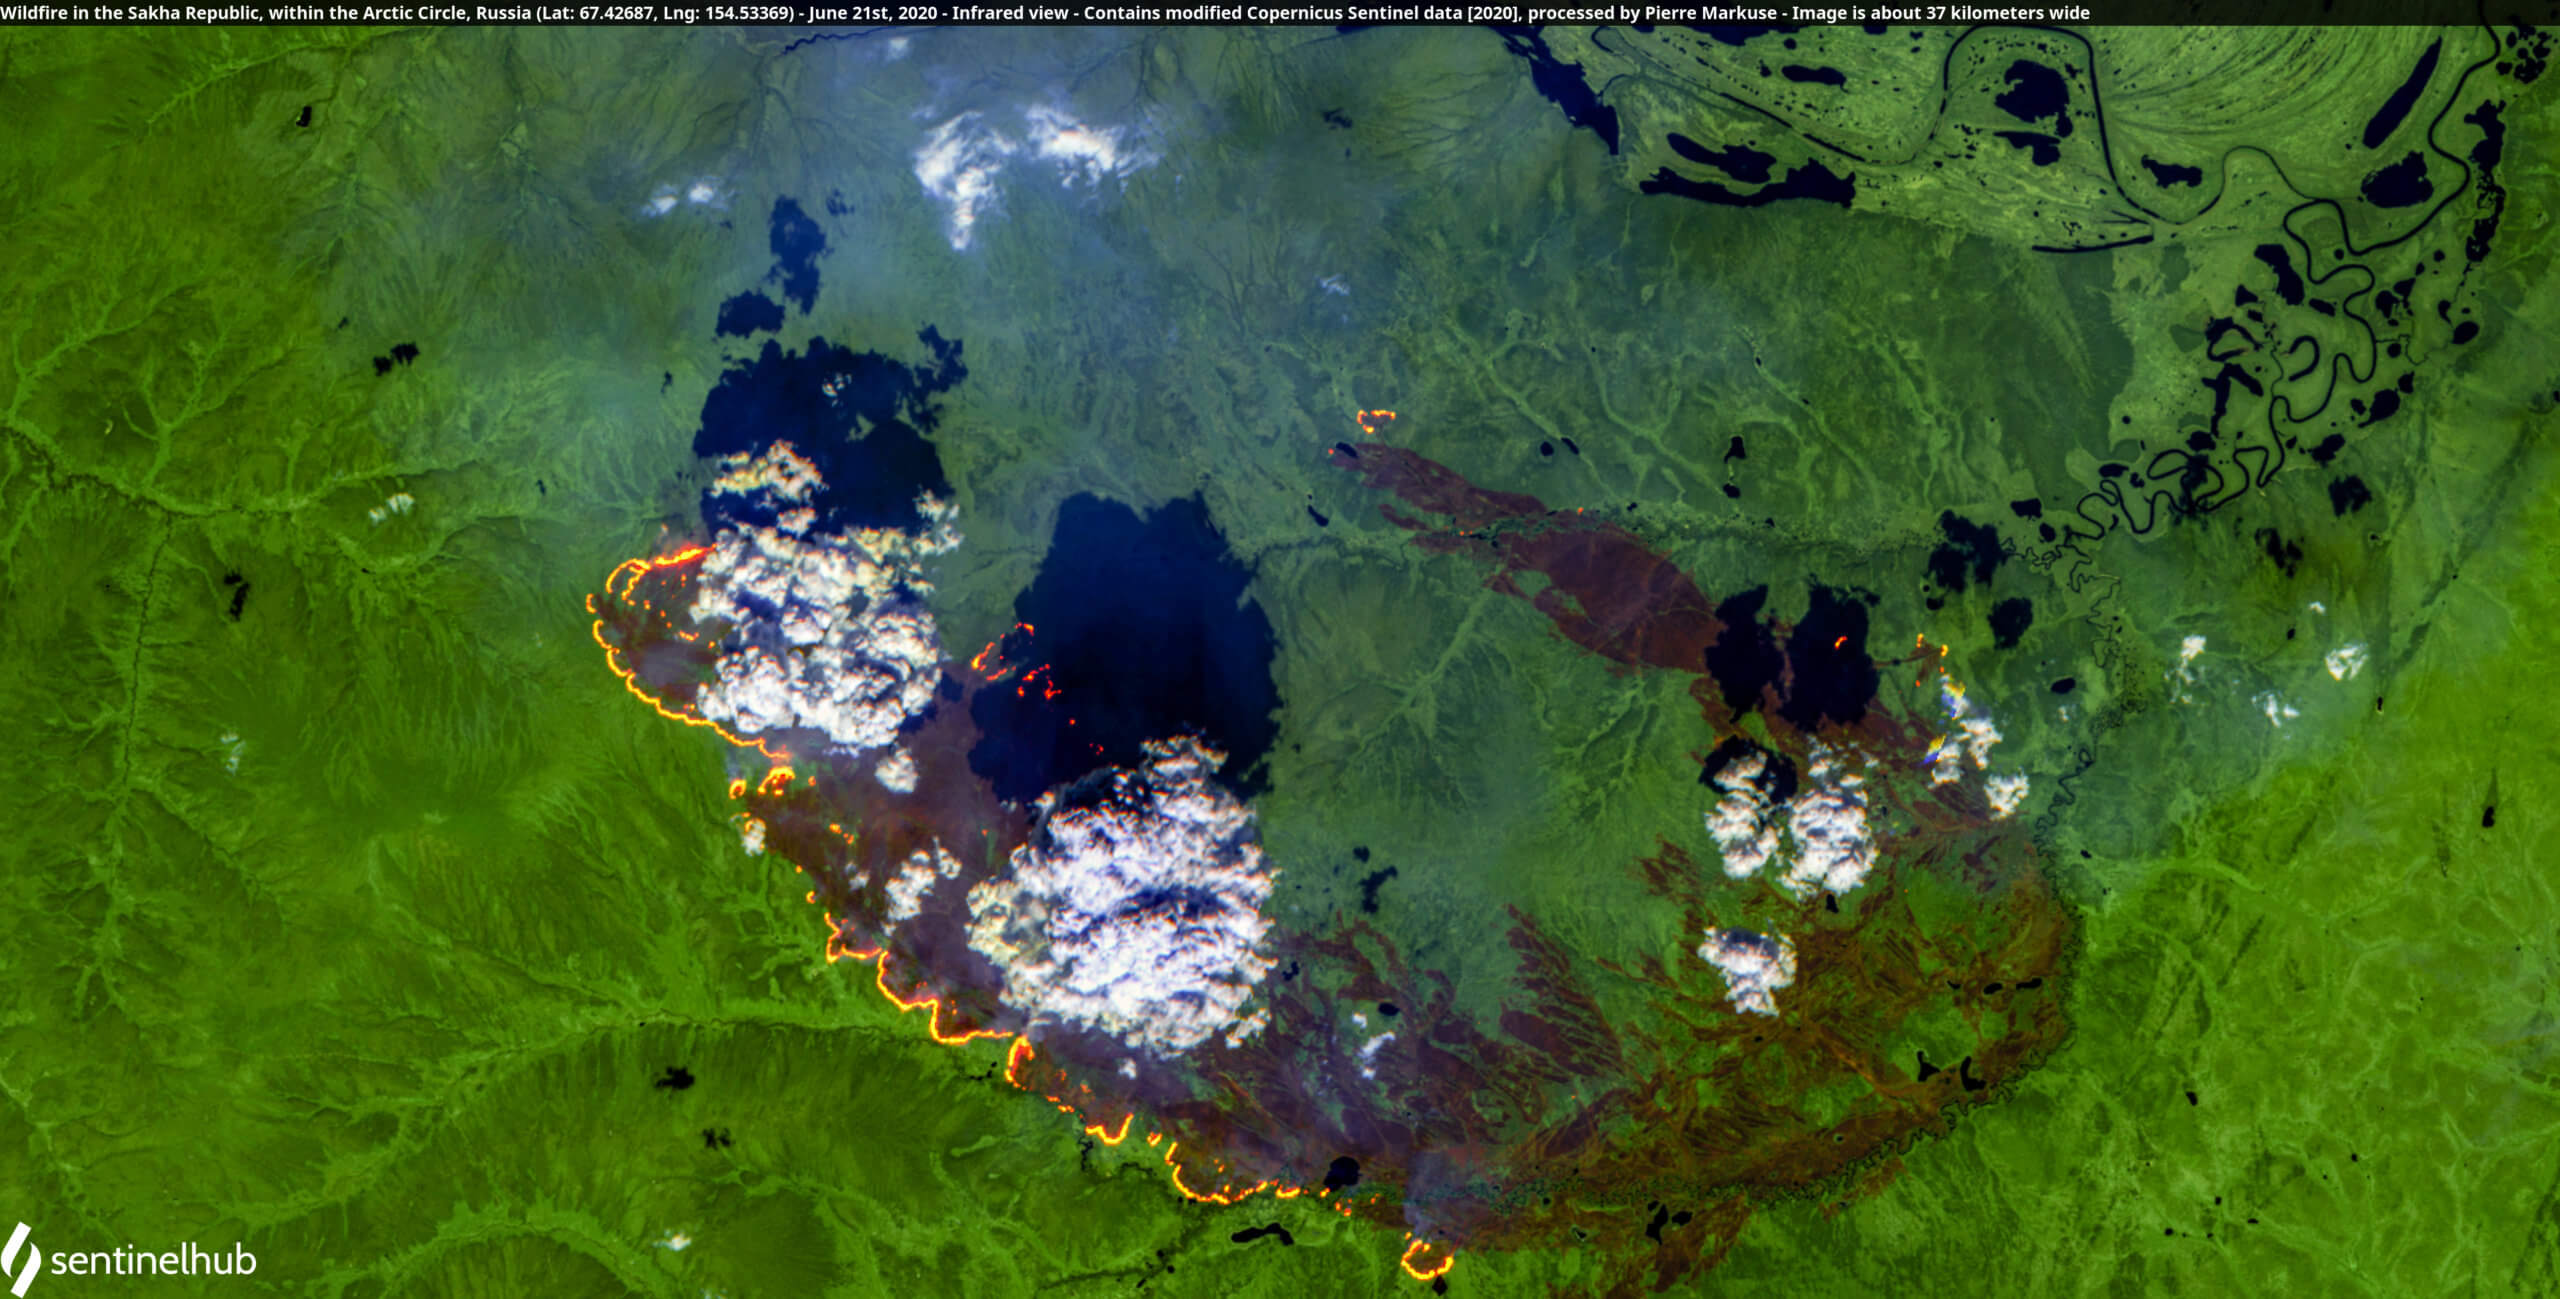
kilometers wide.
INTRODUCTION
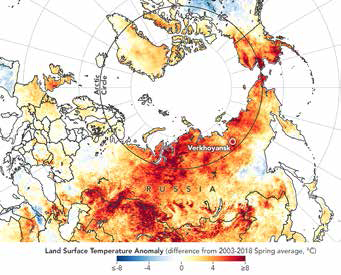
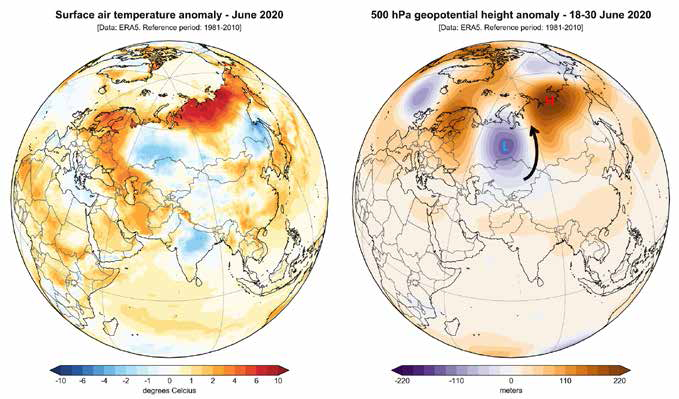
The year 2020 started out with record high temperatures across much of Siberia (Figure 1). Average spring temperatures were more than 8 degrees C over long-term means in many areas. Scientists from the World Weather Attribution Organization concluded that that these extreme temperatures could almost certainly be attributed to long-term climate change (Ciavarella, et al., 2020). The result was early snowmelt and rapid drying of fuels in many areas. While temperatures in southeastern and western Siberia became cooler than average by late June due to changes in atmospheric circulation patterns (Figure 2), the stage was set for high fire hazard across much of the region. Whether you get your news from mainstream media, Twitter, or the Siberian Times, it would be hard to have missed the chatter about the severe fire season in northern parts of Siberia this past summer. In this article we provide some basic information about monthly and latitudinal distributions of fire in Siberia from March through September of 2020 and compare the annual relative importance of fire in northern Siberia to total burned areas in Siberia for 2000-2020. Russia has a large firefighting organization, comprised of the national Aerial Forest Protection Service (Avialesookhrana) and local fire brigades. In the northern areas of the country (mainly above 65N latitude in Central and Eastern Siberia) the primary mode of fire detection is through satellite monitoring. Fires in this region are typically not suppressed, except immediately around the sparsely-scattered towns, villages, and industrial sites. Suppression is more active below about 65 degrees N latitude, but many fires even in those areas are little affected by suppression. About 3–10% of the fires each year can get quite large, and these fires comprise a high percentage of the burned area. At northern latitudes, any fire under 2,000 ha (about 5,000 acres) is considered a “small” fire, and individual fires over 100,000 ha (250,00 acres) are quite common. However below approximately 65 N latitude, where fire detection is typically by on-ground monitoring and aerial fire observers, any fire over 200 ha (500 acres) is classified as a large fire. For residents in most of the US or any other northern country, with the possible exception of Canada, the scale of the landscape and therefore the amount of area burned every year in Siberia can be hard to imagine. Siberia extends from the Ural Mountains to the Russian Far East and from the Chinese and Mongolian borders (about 50 degrees N) to the Arctic Ocean (about 75 degrees N). It covers over 10 million square kilometers (nearly 4 million square miles), about 6.6 million square kilometers of which is forested.
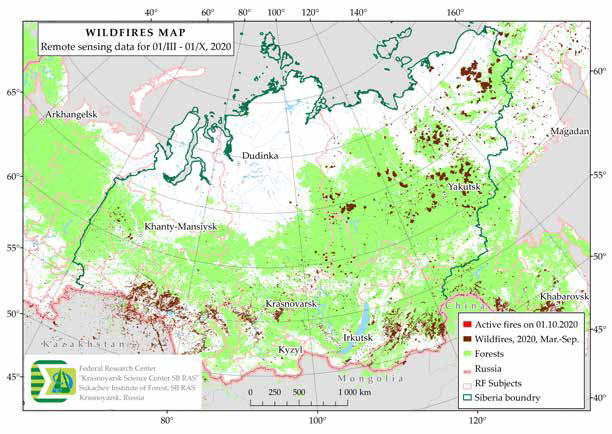
The borders of Siberia are defined in several different ways; the area we are considering is outlined in Figure 3. A typical fire season in Russia starts in the south around March and gradually moves to the north as the weather warms and the snow melts. Early to mid-summer is the primary season for fires in the far north (above 65 degrees latitude), but the active fire season in middle latitudes can have a second peak in August, and occasionally into September (Valendik 1996; Soja et al. 2004 ). The earliest fires are in steppe regions along the Chinese-Mongolian border. Many of these are relatively short-lived agricultural fires; others may be quite extensive. (E. Ponomarev, data on file). There was intense media, scientific, and social media interest in northern Siberia fires generated by this summer’s severe fire season in northern parts of Siberia (e.g. Berwyn 2020; McCarty et al. 2020; plus many Twitter posts on satellite data by Mark Parrington, Thomas Smith, Pierre Markuse and others). This article attempts to put these fires in perspective with both the 2020 fire activity throughout Siberia and the extreme interannual variability of fire activity
across the region. Our analysis is based on burned area. We do not discuss fuel consumption or emissions, although we recognize that these are important considerations for understanding the interactions of fire with carbon cycles and greenhouse gases. For the current article we have compiled information on the seasonal and latitudinal patterns of fire across Siberia for the 2020 fire season, and on the relative importance of far northern fires (above 65 degrees north) over the past two decades. While much of the press and other online information has talked about Arctic fires, we have chosen to use latitudinal bands. This is because the Arctic circle (about 66.5 degrees N) has little specific relevance to vegetation and fuels distribution in Siberia, where the forest/tundra boundary ranges from below 65 to over 70 degrees N latitude.
earthobservatory.nasa.gov/images/146879/heat-and-fire-scorches-siberia
BURNED AREA ESTIMATION
We used satellite data from NOAA/AVHRR (2000 – 2003), NOAA and TERRA/MODIS (2003 – 2006), and TERRA, AQUA/MODIS (2007 – 2020) which has been received daily by the Krasnoyarsk receiving station since 1996 (Sukhinin et al., 2004). Active wildfires were detected by analyzing reflectance and temperature values in near-infrared (0.8-0.9 μm), medium-infrared (3.5-4.0 μm) and long-wave infrared (11 – 12 μm) spectral ranges.
Generating the wildfire data base was a multistep process, including: (1) active fire detection; (2) the creation of fire polygons from adjacent fire pixels; and (3) the correction of resulting polygons. The processing chain for MODIS data was adapted from Giglio et al. (2003) by incorporating several adjustments in background characterization and detection probability estimation (Shvetsov, 2012).
Active fire pixels detected in a series of successive satellite images were combined into individual fires (polygons for GIS). For each fire we determined the location, the first and last date of registration of the fire, and the polygon area. Especially for small fires, active fire data overestimates fire size because the heat signature is reflected over a larger area than the fire. After aggregating fire detections into fire polygons, the active fire database records were calibrated to burned area using 112 scenes of Landsat post-fire imagery over three fire seasons (2011-2013). The sample included about 5% of the fires in the study area for those years. We developed linear regression equations for four fire size classes to describe the relationship between initial burned area estimates from MODIS hotspots and burned area of fire scars observable on Landsat. These equations were used to adjust fire polygons for the rest of the active fire detection data (Ponomarev and Shvetsov, 2015). As expected, corrections were greatest for smallest size classes. For fires up to 200 ha the area of the thermal signature was three times the estimated burned area. This overestimate decreased rapidly with fire size, such that for fires over 2000 ha to 50,000 ha the burned area was 80 percent of the active fire area. No calibration was necessary for fires over 50,000 ha. In a typical year 75 percent (up to 90% in extreme seasons) of the burned area in Siberia is in fires over 2,000 ha. (Ponomarev et al. 2019)
VEGETATION CHARACTERIZATION
We used the USSR 1990 landscape map (see Soja et al. 2004) as well as a map of major Siberian forest types for 2018 (VEGAPRO Service of the Russian Academy of Sciences’ Space Research Institute – IKI, Moscow, http://pro-vega.ru/maps/) to determine the land cover type associated with each fire. Polygons were classified as forest or non-forest. Some of the non-forest fires, especially in the south, are visible for one day or less. Most of these are agricultural fires and are under 200 ha. In 2020, such short-lived springtime fires accounted for about 55% of total numbers, and 13% of the total area burned.
RESULTS
Figure 3 shows all the 2020 fires observed for Siberia and adjacent areas, such as China and the Russian Far East. The data we present are only for Siberia (the area bordered in dark green). Forest areas are shown in light green. This map illustrates both the broad distribution of fires across northern Asia and the patchiness of where fires occurred. It is typical in Siberia to have fire outbreaks in different regions from year to year. Where large, persistent areas of fire occur in a given year is determined largely by atmospheric circulation patterns, including the occurrence of dry lightning storms. The position of loops or waves in the Jet Stream, and how fast these Jet Stream waves are moving from west to east can determine the location and duration of cool wet and hot dry periods, which have a strong effect on when and where large and severe firesoccur (Valendik et al., 2014). Figure 3 illustrates how a loop in the Jet Stream can affect surface temperatures. This transition from higher than average spring temperatures across Siberia, to cooler temperatures (and rainfall) in areas of southeastern, central and western Siberia in late June is reflected in the
spatial distribution of fires. There were few fires in the region where cool air and a low-pressure system disrupted the drought. The largest burned areas (Figure 3) are found where high temperatures and drought persisted into the summer. These prolonged dry periods in northern regions, especially in parts of north-eastern Siberia, led to an unusually severe fire season over a broad region.
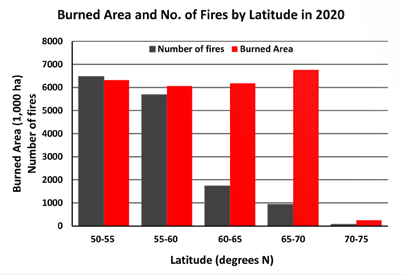
The latitudinal distribution of Siberian fires in 2020 is illustrated in Figure 4. Our total estimated burned area, which includes forest and all types of non-forest fires in Siberia
from the beginning of the fire season in March through the end of September, 2020, was about 26 million ha (64 million acres). Note that this is different from official data, which would cover fires only in forest zones. About 31 percent (8.4 million ha; 20.8 million acres) of the fires in 2020 occurred in the steppe regions in southern Siberia. Thirteen percent (3.5 million ha; 8.6 million acres) was in tundra to the north. About 37 percent (14.3 million ha; 35.3 million acres) was in various forest types, including pine, mixed conifer, and larch forests (Table 1). Over the course of the fire season, burned areas were similar in all latitude bands (except north of 75 degrees; Figure 4). Total burned areas ranged from about 6.1 million ha (15.1 million acres) between 60 and 65 degrees N to 6.8 million ha (16.8 million acres) between 65 and 70 degrees N. The number of fires, however, varied markedly in the different zones, with many small fires in the south, and a lesser number, but larger, fires in the north. This is a function of both vegetation and differences in fire suppression and accessibility from south to north. Many of the large southern fires are either in steppe or in pine and larch vegetation with herbaceous or lichen surface fuels, where fire is generally lower intensity and easier to suppress. Farther north, forest understories are denser and moister, natural fire intervals are longer, fires occur only under conditions of severe fire danger, and fires that do burn are more likely to be high-intensity crown fires. Furthermore, the active detection and suppression of most fires below 65 degrees N differs from areas north of 65 degrees, where detection is mostly by satellite and suppression actions are focused primarily on protection of life and property. Lastly, in the 2020 season the severe, prolonged drought in the more northern areas led to higher than usual fire intensity and made fires more difficult to suppress, and less likely to be extinguished by rainfall events. These factors combined lead to the trend shown in Figure 4.
HOW UNUSUAL WAS THE 2020 FIRE SEASON IN NORTHERN LATITUDES?
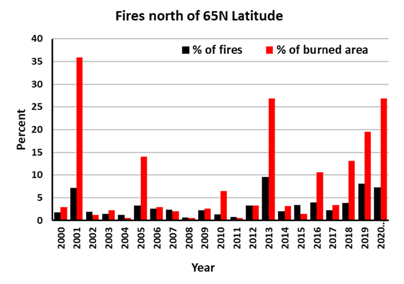
While the dominance of northern fires was unusually large in 2020, it was not unprecedented (Figure 5). Since 2000, there have been several years when a high percentage of the burned area in Siberia occurred north of 65 degrees. In almost 2/3 of years less than 5% of the burned area was in this region. There were only 7 years (33%) when more than 10% of the burned area was in this region. Nonetheless, burned areas in 3 of these years (2001, 2013, 2020) exceeded 25% of the total area burned in Siberia. While this past year has clearly been unusual in the area burned in Northern Siberia, it is hard to see a trend over the 21 years of record. In fact, the year with the largest percent of burned area in these northern regions was 2001. Extensive high severity fires were observed only in 2001, 2005, 2013, 2019, and 2020. If you exclude these years of extreme fire activity, the average percent of total Siberian burned area that occurred north of 65 degrees was 1.9% from 2000-2009 and increased to 3.0% from 2010-2020. This provides at least preliminary evidence of a possible trend toward increased burned areas with warming climate. While these data align with what we might expect as climate warms, interannual variability is so high that more than two decades of observation is needed for conclusive evidence of a long-term northward shift in fire activity toward the Arctic and northern boreal zones. The data do not support a relationship between the number of fires and area burned. This is not surprising as correlations between the number of fires and burned areas are generally weak. Burned area is largely driven by a relatively small number of the largest fires. Although we do not show it here, other data indicate that the
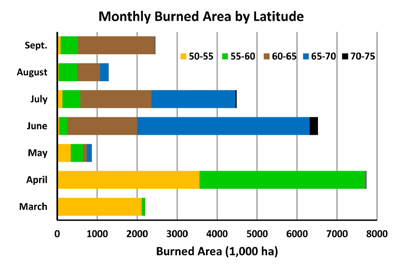
high fire years in the far north are not necessarily correlated with high fire years in the rest of Siberia. The seasonal trends in where fires occurred in 2020 are documented in Figure 6. Some fires burned for several weeks. In this case the burned area of an individual fire could be distributed across more than one month. There were large areas burned at southern latitudes starting as early as March and into April. By April large areas were burning between 50 and 60 degrees north. Much of the March and April burning was in steppe, some of which would have been agricultural burns. These early fires in southern regions are carried by dead herbaceous fuels, which dry out and become flammable after snow melts in the early spring.
While there are large areas of steppe fires, some of these southern fires also occur in conifer forests, especially in pine and southern larch forests. Larch is a deciduous conifer that can have a lush herbaceous understory, whereas the southern pine forests tend to be more open with grass and other low surface fuels. As the grasses and other herbaceous vegetation begin their spring growth in steppe and southern forests, the understory decreases greatly in flammability. While there was a lot of fire activity between 55 and 60 north in April, only 12 percent of this burned area and 18% of fires were in forest. The low burned area in May reflects a transition period between fire season in these southern areas, and increased fires in more northern forests as forest floor fuels, or fuels in normally-wet open peat areas, dried where summer drought occurred. June and July of 2020 were the most active months of the summer fire season north of 60 degrees. This is the period when large fire outbreaks were observed in the far north (65-75 degrees N). While much of the publicity speculated that large areas of peat were burning, as occurred in 2012 in western Siberia, we
estimate that fires in peat bogs accounted for 0.82 million ha in 2020. In 2012 1.44 million ha of peat bogs burned, but these were primarily in western Siberian on a vast alluvial plain that
contains extensive peat bogs in a peat-forest matrix. In 2020, most of the northern fires occurred in forested areas. Many of these were in northern larch forests on permafrost, where surface fuels are typically dominated by mosses, and organic layers may be quite deep.
SUMMARY
Unusually high spring temperatures in 2020 set the scene for a potentially severe fire season, especially in areas where these extreme temperatures persisted throughout the summer. Burned area data show that there was an unusual amount of fire activity in the 2020 fire season in northern Siberia (north of 65 degrees). This fire activity was associated with severe summer drought that led
to extreme fire behavior and long-duration fires. In March fires started at lower latitudes (50-55 degrees N) and expanded to midlatitudes (55-60 degrees N) in April. After a lull in May, fire activity increased in June and July from 60-70 degrees N. The largest burned area during this period was north of 65 degrees, near or above the Arctic Circle. Most of this fire was in areas classified as forest, some of which, based on evidence not reported here, was almost certainly intermixed with peat bogs. While the fire season extended into August and September, actively burning area decreased and fires were focused on latitudes below 65 degrees N. Some fires continue to burn at this writing, but areas of active fire were decreasing rapidly in early October. Because of the extreme interannual and geographic variability of fire occurrence, severity, and burned area in Siberia, it is difficult to conclusively attribute this summer’s fires to changing climate, although this type of severe fire season in northern Siberia certainly can be expected to become more common in the future.
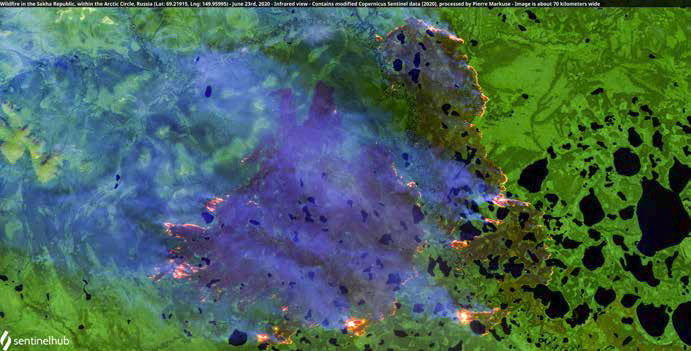
June. Image is about 70 km wide.
REFERENCES
Berwyn, B. (2020) Scientists Attribute Record-Shattering Siberian Heat and Wildfires to Climate Change, InsideClimate News, Jul 15, 2020 https://insideclimatenews.org/news/15072020/siberia
Ciavarella, A., Cotterill, D., Stott, P., Kew, S., et al. (2020) Siberian Heatwave of 2020 Almost Impossible without Climate Change. World Weather Attribution Organization. Published online:
Siberian heatwave of 2020 almost impossible without climate change
Giglio, L., Descloitres, J., Justice, C., Kaufman, Y. (2003) An enhanced contextual fire detection algorithm for MODIS. Remote Sensing of Environment 87:273–82.
McCarty, J.L., Smith, T.E.L. & Turetsky, M.R. (2020) Arctic fires re-emerging. Nature Geoscience 13, 658–660. https://doi-org. mutex.gmu.edu/10.1038/s41561-020-00645-5
Ponomarev, E. I., Byambasuren, O., Eritsov, A.M. (2019) Remote Sensing for Wildfire Monitoring in Siberian Forests // Fire Management Today. 2019. Vol. 77. No. 1. P. 62–68.
Ponomarev, E.I., Shvetsov, E.G. (2015) Satellite detection of forest fires and geoinformation methods of calibration of the results. Issled. Zemli Kosmosa (Studies in Earth Remote Sensing) 1:84–91, doi:10.7868/S0205961415010054. (In Russian)
Shvetsov, E.G. (2012) Probabilistic Approach of Satellite Detection and Assessment of Fire Energy Characteristics in Forests of East Siberia. Ph.D. Thesis, V.N. Sukachev Institute of Forest,
Krasnoyarsk, Russia. (In Russian)
Soja, A.J., Cofer, W.R., III, Shugart, H.H., Sukhinin, A.I., Stackhouse, P.W., Jr., McRae, D.J. and Conard, S.G.(2004) ‘Estimating fire emissions and disparities in boreal Siberia (1998 through2002)’, Journal of Geophysical Research 109(D14S06), 1–22. or doi: 10.1029/2004JD004570.
Sukhinin, A., French, N.H., Kasischke, E., Hewson, J., Soja, A., Csiszar, I., Hyer, E., Loboda, T., Conard, S., Romasko, V.I., Pavlichenko, E., Miskiv, S.I. and Slinkina, O. (2004). AVHRR-based mapping of fires in Russia: New products for fire management and carbon cycle studies. Remote Sensing of Environment, 93, 546-564.
Soja, A.J., Sukhinin, A.I., Cahoon Jr, D.R., Shugart, H.H. and Stackhouse Jr, P.W. (2004) AVHRR-derived fire frequency, distribution and area burned in Siberia. International Journal of
Remote Sensing, 25(10), pp. 1939-1960.
Valendik, E.N. (1996) Temporal and spatial distribution of forest fires in Siberia. In: Fire in Ecosystems of Boreal Eurasia, GG. Goldammer and VV Furyaev, eds. Kluwer. Pp. 129-138.
Valendik, E.N., Kisilyakhov, E.K., Ryzhkova, V.A., Ponomarev, E.I. and Danilova, I.V. (2014) Conflagration Fires in Taiga Landscapes of Central Siberia. Geography and Natural Resources. 2014. Vol. 35. № 1. P. 41–47. doi:10.1134/S1875372814010065.
About the Authors:
 Susan G. Conard, Affiliate Faculty, George Mason University, Fairfax, Virginia USA.
Susan holds a BA in environmental studies from Antioch College and MS and PhD degrees in ecology from the University of California, Davis. She worked as a fire researcher and research project leader with the US Forest Service from 1983 to 1996. From 1996 through 2008 she was the Forest Service National Program Leader for Fire Ecology Research. She currently holds an Affiliate Faculty position at George Mason University. Dr. Conard is a past president of the International Boreal Forest Research Association, and a Fellow of the American Association for the Advancement of Science (AAAS). Her research has focused on wildland fire, with an emphasis on integration across scales and disciplines, including fire regimes and fire effects, fire behavior, remote sensing, and fire/climate interactions. She has conducted research in western North America and Siberia. Dr. Conard has been co Editor-in-Chief of International Journal of Wildland
Fire since her retirement in late 2008. She has over 75 publications. ([email protected])
 Evgenii I. Ponomarev, Laboratory of Forest Monitoring, V.N. Sukachev Institute of Forests, Federal Research Center, Krasnoyarsk Science Center SB RAS, Krasnoyarsk, Russia.
Evgenii is a senior scientist at the V.N. Sukachev Institute of Forests, Federal Research Center, Krasnoyarsk Science Center, Siberian Branch, Russian Academy of Sciences. He is also an Associate Professor at the Siberian Federal University in Krasnoyarsk, Russia. Research interests include wildfires, post-fire effects, remote sensing, and GIS technology. He has led the wildfire remote sensing program in Krasnoyarsk for the past 10 years and has over 60 peer-reviewed publications on fire in Siberia, both in Russian and in English. Dr. Ponomarev received his PhD in 2003 on “Operational Assessment of Fire Danger in Forests Based on Satellite Data”. ([email protected])